The print system can widen the blur. Whether you can see it is a different question.
Near the end of the previous article, “What Is Your Circle of Confusion?,” I wrote this:
“The print itself adds blur. … That is a whole article in itself, so here I will only say this: a print is not transparent.”
This is that article.
What the previous article looked into was the 0.03 mm circle of confusion for the 35mm format — whose number it was, and under what conditions. 0.03 mm is not a physical constant. It compresses a set of viewing conditions — enlarge about 5×, view the whole image from about 25 cm, accept about 2 arcminutes of blur — into a single number.
That left one piece of homework.
Suppose you have thought things through to 0.03 mm on the camera side. What happens to that blur once it is printed? How much do the printer and paper change it? And can you see it?
Let me say this up front. This article does not end with “yes, you can see it,” nor with “no, you can’t.” How much the printer and paper widen the blur can be stated, to within an order of magnitude, once you fix the conditions. But the data that would decide whether the eye sees it as blur has not been measured on prints. So this article goes through, in order, how far the numbers can take us and where they stop.
The ending is the same as last time: it hands the question back to you.
Why I Said It Was “a Whole Article in Itself”
In the previous article I described three conditions under which I checked focus: looking at the original through a 3.5× loupe, looking at the 100% view on a monitor, and going to 100% only where it matters. The way I judged changed three times; the circle of confusion stayed at 0.03. That was where the last article ended.
All three were about the original, or about the data.
But my photographs reached people’s eyes as prints. For exhibitions, that meant zenshi and dai-zenshi (Japanese paper sizes, about 46 × 56 cm and 51 × 61 cm), and at the largest 1 × 2 m. Is the blur the same thing before it becomes a print and after?
While researching the previous article, I compared the published measurements, and it turned out that the blur produced by a printer and paper can be of the same order as a 0.03 mm blur enlarged to A4. It cannot be called negligible. But which of the two is larger switches with the paper, the printer model, the size, and the viewing distance. It was not something I could settle in a paragraph, so I gave it an article of its own.
What Comes After the 0.03 mm
A 0.03 mm blur on the sensor plane (or film plane) does not arrive on the print unchanged.
First, it is enlarged along with the image. That is geometry. Enlarge 5× and it becomes 0.15 mm; enlarge 20× and it becomes 0.6 mm. This part is decided by calculation.
After that comes the printing process.
Inside the printer driver, or separate print software called a RIP (raster image processor), the image data is resampled onto the grid the printer can accept. Colors are converted into combinations of inks. Smooth gradations are replaced by the density of fine dots (halftoning). The dots are placed on the paper by the print head. The ink spreads a little on the surface of the paper, and the light that enters the paper comes back out from a slightly different place. In silver-halide digital exposure there is no ink: a laser or LED exposes photographic paper, which is then developed.
Whichever method is used, what is on the finished print is the enlarged original blur with the printing process’s own softening laid over it.
In this article I will lump together the printer, the ink (or the light-sensitive material), the paper, the print mode, and the driver or RIP processing, and call them the “print system.” How blur is transferred is decided by neither the printer alone nor the paper alone, but by the combination.
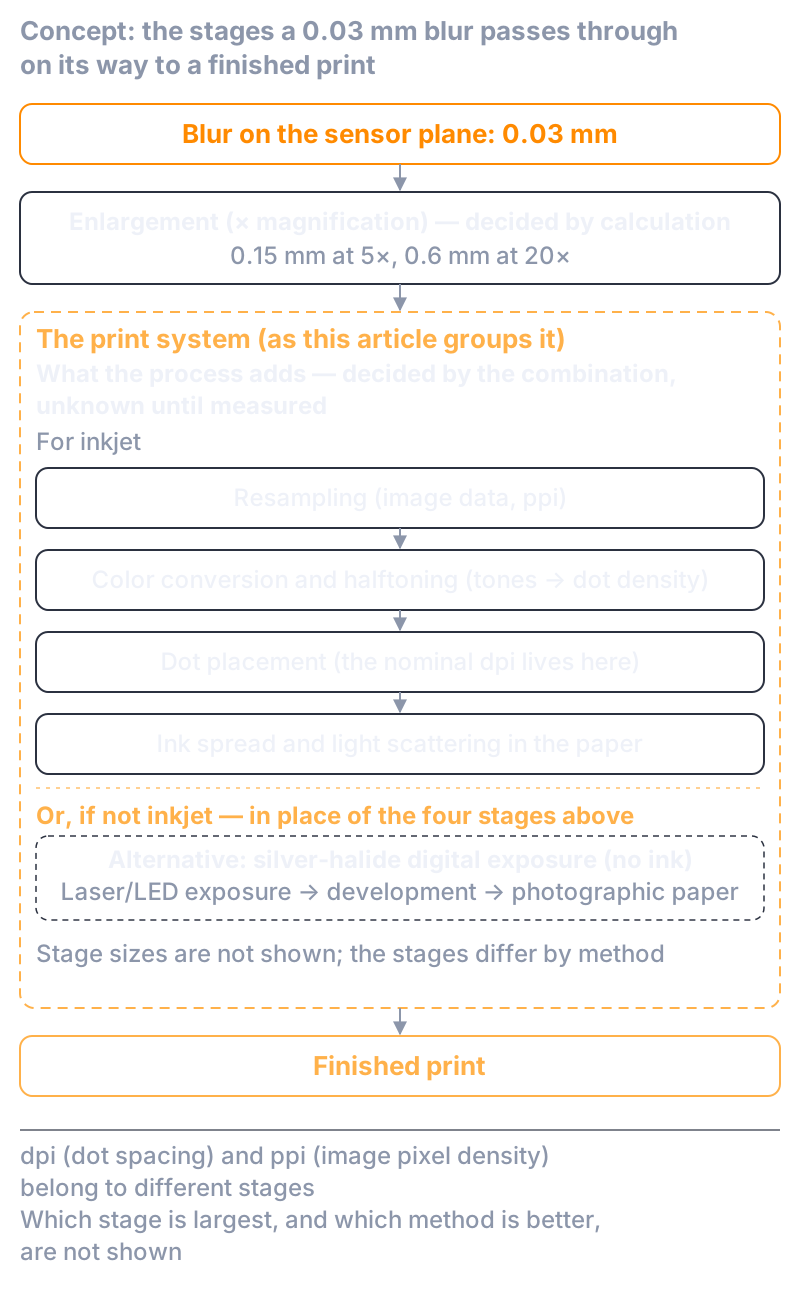
Figure 1: The stages a 0.03 mm blur on the sensor plane passes through on its way to a finished print. Enlargement is decided by geometry. What the print system after it adds — resampling, halftoning, dot placement, ink and paper; or, for silver-halide digital exposure, exposure, development and photographic paper — is decided by the combination, and cannot be known without measuring. The nominal dpi belongs to the dot-placement stage; ppi belongs to the image-data stage. The figure does not show how large each stage is, nor rank one method above another.
If the Box Says 5760 dpi, Isn’t That More Than Enough?
Printer specifications carry numbers like 5760 × 1440 dpi or 2400 × 1200 dpi. Thousands of dots per inch. If a printer can lay down dots that finely, surely a 0.03 mm blur is reproduced with room to spare? I think that is the natural way to read it, too.
But check what the number actually stands for, in the manufacturers’ own explanations, and this is what you find.
In Epson’s specifications for the SC-PX1V, the footnote to 5760 × 1440 dpi says that the printer prints “with a minimum dot spacing of 1/5,760 inch” (my translation from the Japanese). In Canon’s specifications for the PRO-4100, 2400 × 1200 dpi carries a note that the minimum pitch between ink droplets is 1/2,400 inch. HP’s user guide for the DesignJet Z9+ has a table with two separate columns: the resolution at which the image is rendered (300, 600 or 1200 ppi — ppi being the number of image pixels per inch) and the resolution at which dots are placed (1200 × 1200 or 2400 × 1200 dpi).
The nominal dpi, then, is a dot-spacing number: how finely the printer can place dots.
Being able to place dots finely and being able to transfer photographic detail finely are not measured the same way. The tone of a single pixel is built from the density of several dots, and after the dots are placed there is still the spreading of the ink and the scattering inside the paper. So a figure of 5760 dpi cannot be read as “5760 lines per inch of photographic detail reproduced.”
That does not make dpi wrong. It correctly describes the performance of the dot-placing side. It just wasn’t the number for what I wanted to know — how blur gets through. The question I put to 0.03 mm in the previous article — what kind of number is this? — needed to be put to dpi as well.
How Much Do the Printer and Paper Widen the Blur?
So how much, then?
That is something you can find out by measuring. There is a method: print stripes or edges, read them back at high resolution, and see how fine a pattern of light and dark the system can still carry. The result is a number of this kind: at how many black-and-white pairs per millimeter does half the contrast still survive?
Published measurements exist. But they are few. And they are old.
In September 2026, I searched the main academic journals and conferences in imaging science and printing, the standards, manufacturers’ technical documents, and the published data of independent testers. Within that range, the measurements of photographic printers I could find were essentially the following, spanning 1999 to 2019.
| Year | What was measured | Ink | Paper | Where half the contrast survives (black-and-white pairs per mm) | Corrected for the measuring system? |
|---|---|---|---|---|---|
| 1999–2000 | Epson PM770C (consumer, 720 dpi) | dye | glossy / matte / plain | about 6.1 / 6.4 / 4.9 | yes (peer-reviewed paper) |
| ca. 2002 | Epson Stylus Photo 1270 | dye | semigloss / matte | about 4.7 / 4.5 | no (scanner included) |
| 2015 | HP DesignJet Z3100 (image data at 600 ppi) | pigment | matte / luster | about 5.3 / 5.4 | no (camera included) |
| 2019 | Epson SureColor P800 (image data at 720 ppi) | pigment | glossy | about 3.5–4.3 | no (scanner confirmed near-lossless up to 16 pairs per mm) |
| 2019 | model not stated (presumed Epson) | not stated | not stated | about 5.1–5.3 | no (camera included) |
Table 1: Published measurements of photographic inkjet print systems. “Image data at N ppi” is the pixel density of the image handed to the printer. The upper three rows are from 1999–2015, the lower two from 2019, and none of them is a “typical value for current printers.” The 1999–2000 values are from a peer-reviewed paper by Chiba University and Seiko Epson; the ca. 2002 values from an independent tester’s tutorial; 2015 from Imatest’s technical documentation; the 2019 P800 from an independent tester’s published article; and the 2019 unnamed-model example from a conference paper by Imatest.
Three things can be taken from this table.
First. I found no published data for the photographic pigment printers currently on sale, measured by a peer-reviewed method that removes the influence of the measuring system (the blur added by the scanner or camera used to read the print). I cannot say such data does not exist. Only that I could not find it.
Second. In the 1999 example, the difference between glossy and matte paper was a few percent, and only the uncoated plain paper was about twenty percent lower. On a different printer, simply rotating the print direction by 90 degrees on the same paper changed the result by about ten percent. Within this range, what can be said is this: the differences among coated photographic papers are not large enough to rank them by paper type. It cannot be said, as a general statement, that glossy paper is sharp and matte paper is soft.
Third. The 2019 P800 example does not come out higher than the 1999 example; it is on the lower side. It is one printer, one paper and one print, measured by one person, so it does not let us say that “today’s printers are softer than they used to be,” nor that they are sharper. All it says is that there is no published data supporting the assumption that things must surely have improved over twenty years.
Enlarge the 0.03 mm and Put It on the Print
Now apply all of this to 0.03 mm.
Enlarged onto a print, a 0.03 mm blur on the sensor plane becomes:
- at 5× (about postcard to 2L / 5 × 7 in size; the original condition behind the 0.03 mm convention): 0.15 mm
- at A4 (about 8.3× on the long side): about 0.25 mm
- at A3 (about 11.7×): about 0.35 mm
- at 20× (zenshi class): 0.6 mm
This is geometry only. The print system has not yet added anything.
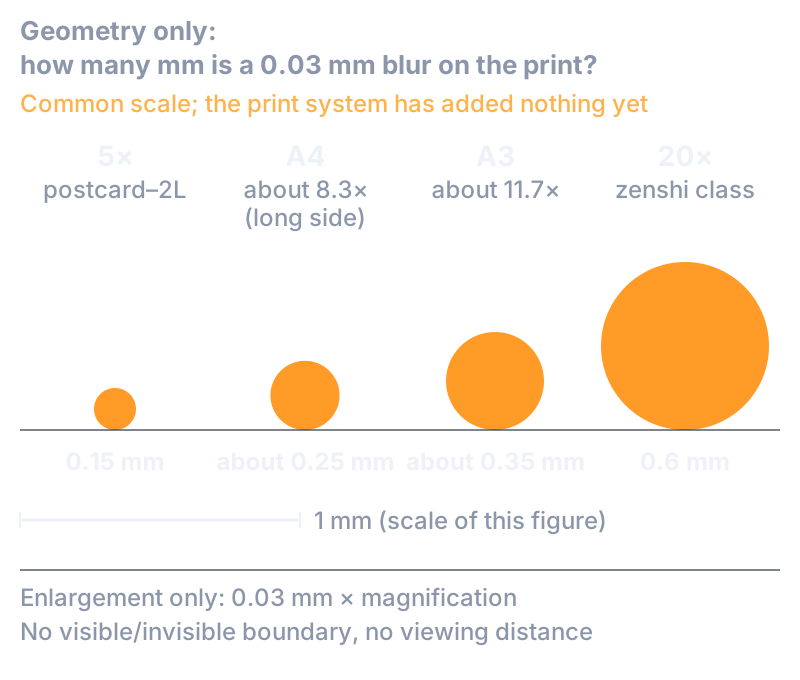
Figure 2: The diameter of a 0.03 mm sensor-plane blur once enlarged onto a print: 0.15 mm at 5×, about 0.25 mm at A4, about 0.35 mm at A3, 0.6 mm at 20×. Drawn to a common scale, with a 1 mm scale bar. This is enlargement alone; the print system has not yet added anything. No visible/invisible boundary and no viewing distance are shown.
Now lay the print system’s blur on top.
The 1999 measurement recorded the shape of the print system’s blur. If you assume that shape, what the print system adds is about 0.08 mm wide on glossy paper and about 0.1 mm on plain paper. Lay this over the enlarged 0.03 mm circle, and the edge — the distance over which it goes from dark to light — widens by roughly twenty to forty percent at 5×, by around ten percent at A4, by a few percent at A3, and by one or two percent at 20×.
So, assuming the print system measured in 1999: at around 5× the print system’s blur and the camera-side blur are of the same order. At A4 it is around ten percent, and the more you enlarge beyond that, the more the camera-side 0.03 mm dominates, relatively speaking.
But as it stands, this calculation assumes the shape measured on a consumer dye printer in 1999. Whether today’s printers have the same shape is not known. The only measurement of a pigment printer closer to the present is the single 2019 P800 example, and if that is fitted to the same shape, the width the print system adds comes out at 1.6–2.1 times the width worked back from the 1999 example — and even at A4 the edge widens by roughly twenty to forty percent. In other words, it falls on the “same order” side.
So for current printers in general, it cannot be said that “from A4 upward, the print system’s influence is small.” Assume the 1999 measurement and you can say it; apply the 2019 example and you cannot; and no published measurement of today’s printers by a corrected, peer-reviewed method has been found. It cannot be decided — that is the accurate statement.
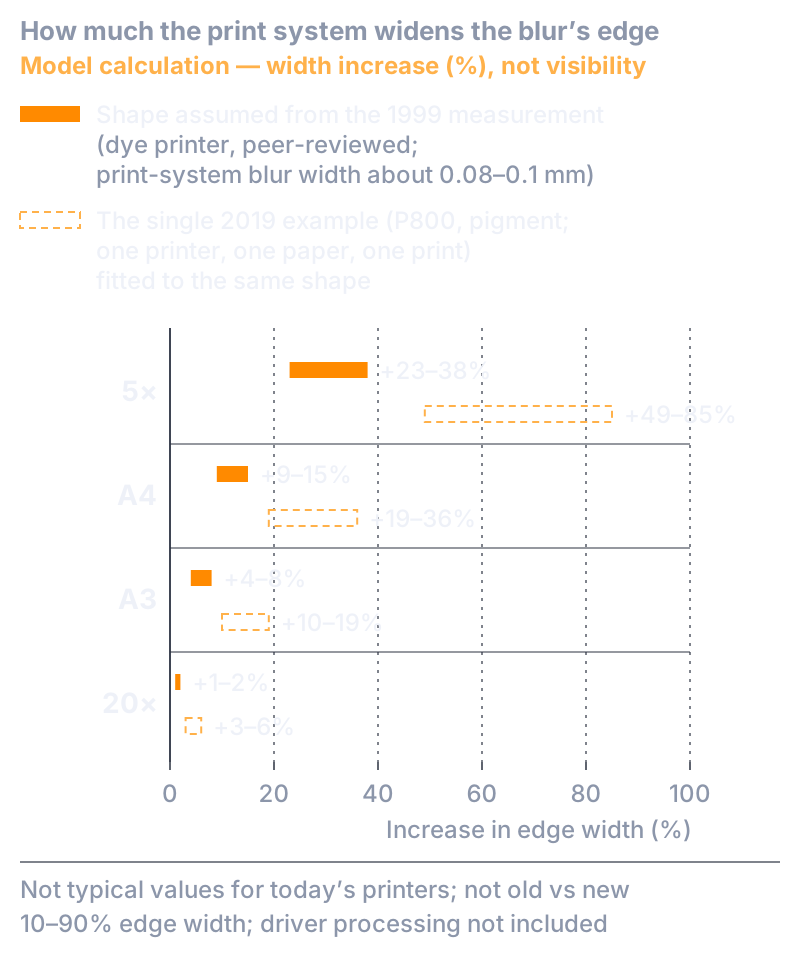
Figure 3: How much the print system widens the edge of the enlarged 0.03 mm blur (a model calculation by this site: the 10–90% edge width, defined in the supplement; driver processing not included). The filled bands assume the shape from the 1999 measurement (dye printer, peer-reviewed paper); the dashed bands apply the single 2019 example (P800, pigment; one printer, one paper, one print) to the same shape. This is an increase in width, not in how visible the blur is. Neither series is a typical value for today’s printers, and the figure is not a ranking of old against new.
One more thing. Every “widens by so many percent” above is about the width of the blur. It is not about how many percent more visible the blur is. That distinction is the axis of the second half of this article.
Should We Just Set a “Circle of Confusion” for the Print, Too?
Having read this far, you may be tempted to think: if there is a circle of confusion on the camera side, then just set one for the print as well. Fix “so many millimeters for this paper on this printer,” and the rest is addition.
It is a natural thought. But it could not be made into a single number. There are three reasons.
First. The print system’s blur is decided by neither the printer alone nor the paper alone. In the 1999 measurement, and in a later measurement by the same group that separated the spreading of the ink from the scattering inside the paper, glossy paper had the largest light scattering of the papers when looked at on its own, yet the smallest ink spread — and as a complete print it came out roughly level with matte paper. The result on the print cannot be predicted from the properties of the paper alone, and ink and paper do not combine by simple multiplication. Change the combination and the only option is to measure again.
Second. The printing process includes optional processing. Epson’s driver has automatic corrections such as “PhotoEnhance” and “Fix Photo” that include sharpness correction. Canon’s Professional Print & Layout has a function that compensates for the loss of sharpness according to the paper, and another that uses depth information from the time of shooting to treat the in-focus and out-of-focus parts differently. Some RIP software has its own sharpening applied just before printing. All of these are the user’s choice, and neither their default states nor how strongly they act is published. Once they are in play, “the print system’s blur” can no longer be expressed as one value — and a function that processes the in-focus and out-of-focus parts separately changes the very thing this article is about, the way blur is transferred.
Third. Even if the physical width of the blur could be made into one number, that number would not decide whether it can be seen. That is the next section.
So this article does not produce a number of the form “the print’s circle of confusion is so many millimeters.” The geometry on the camera side; the transfer through the print system; the size of the print; the viewing conditions; the viewer’s eyes. With the published data that exists today, these five could not be folded into one number. That is the conclusion of the research.
What the Numbers Can Say, and What They Can’t
Let me stop here for a moment.
The numbers can say two things: how many millimeters a 0.03 mm sensor-plane blur becomes on the print (decided by geometry), and how much the print system widens that width (decided by measuring — though the published measurements are few and old, and for today’s printers we do not know).
What the numbers cannot say is whether the viewer sees it as blur.
Why not? Because, within the range I searched, I found no study that showed blur on a print and measured how small a blur people can still detect. What exists are experiments on screens, and there, the smallest amount of blur people can detect varies about fivefold depending on what is in the picture, and about five- to sixfold depending on contrast. There is also a finding that people are more sensitive to additional blur in an image that is already slightly blurred. A line saying “below this width, nobody can see it” has not been drawn even on a screen.
There are methods for rating print quality numerically. But those are scales of “how good it looks,” in steps; they are not the probability of detecting a given blur.
That is why the “widens by so many percent” of the previous section cannot be read as “so many percent easier to see.”
This is the heart of this article. How many millimeters the blur spreads to on the print and whether a person perceives it as blur are two different questions. The first is a matter of calculation and measurement; the second has not yet become a single number. It is the same thing I wrote in the previous article — that even the angle alone is not enough.
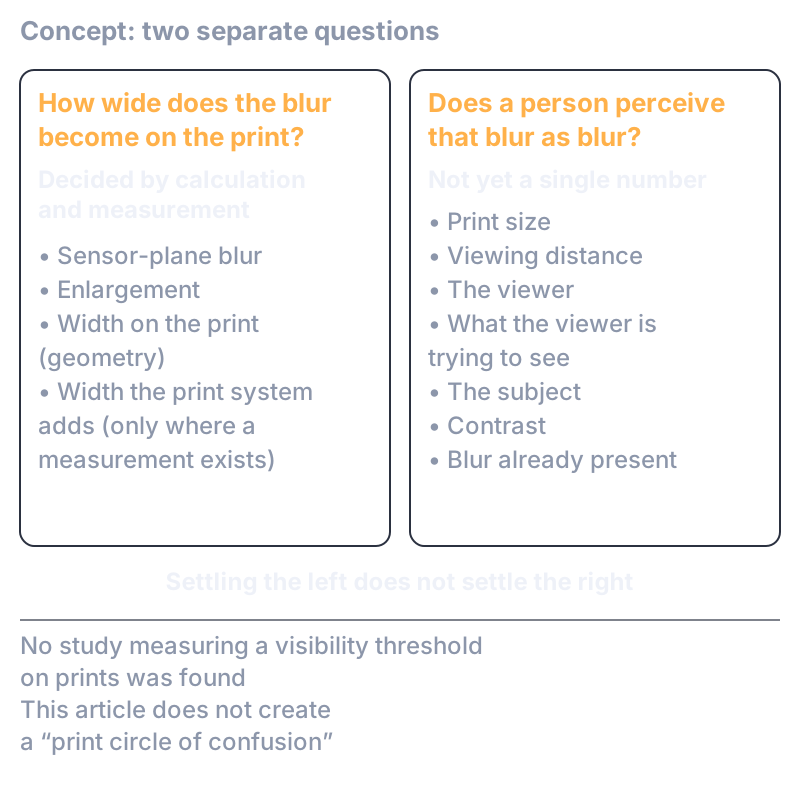
Figure 4: Two separate questions. On the left, “How wide does the blur become on the print?” — decided by calculation and measurement. On the right, “Does a person perceive that blur as blur?” — which involves the print size, the viewing distance, the viewer, what the viewer is trying to see, the subject, the contrast, and the blur already present, and has not yet become a single number. Settling the left does not settle the right. That is why the two are not joined by an arrow.
That is what the research found.
While writing this up, something occurred to me. Where the numbers stop — what had I been doing there myself? Looking back: on the output side, I never had numbers.
I Never Had Numbers for the Print
On the shooting side, as I wrote in the previous article, I used the number 0.03. On the output side, I have never kept track of a printer’s or a paper’s performance in numbers. More precisely, I never had such numbers at all.
From 1995 to around 2000, prints for exhibitions went to a professional lab, Shashinkosha. As I remember it, they were optical prints — the transparency put in an enlarger and exposed onto photographic paper. Not inkjet.
So the measurements set out in the first half of this article do not apply to the prints I was making then. The first half dealt with inkjet and digitally exposed print systems; my prints were optical enlargements. I want to keep that distinction clear.
At the time, this is how I thought about it:
“We’re already sending them to the best pro lab in Japan. If the quality isn’t satisfying there, there’s nothing better to be had.”
“The best in Japan” was my own assessment at the time, not an objective ranking. But I genuinely believed it, and so the idea of putting numbers on the printing process never occurred to me. Looking back now, I don’t think I was taking print quality lightly. I think I regarded it as an area where I held no numbers of my own, and which I entrusted to the specialists I believed were the best.
The same went for finishing. I did not apply extra sharpening to suit the print size. Push it too far and it does harm; so I finished the image the way I always did. Beyond that, if sharpness, saturation or color needed adjusting, I left it to Shashinkosha. What the lab actually did, I do not know.
How I Looked at the Finished Prints
Entrusting the printing did not mean exhibiting prints I hadn’t looked at. These were works for a group exhibition; anything that wasn’t up to standard couldn’t go on the wall. I inspected the finished prints rigorously.
There were two ways of looking. Step back and take in the whole — then I was mainly looking at color and atmosphere. Move in close and look at the detail — then it was mainly focus and grain. The 3.5× loupe I used on the originals never came out for the prints. The prints I looked at with the naked eye.
Even with the big 1 × 2 m prints, of course, I went up close and looked at the detail. A small amount of camera shake that I hadn’t been able to make out through the loupe on the original can show up once it is enlarged that far. The story in the previous article — stepping up to that print and thinking “soft” — comes from looking in exactly this way. Whether the softness of that print was the printing process, the shooting, or simply too much enlargement, I still don’t know. All I know is that I went up close and looked.
If something could be fixed, I asked for a reprint. Some things couldn’t be fixed no matter how you asked, and then the lab would decline.
For an exhibition, I never designed a print around the distance the viewer would stand at.
“Some people only ever look from a distance; some come right up close and look hard. That’s up to them.”
That is my own view, not a measurement of how visitors actually behave. In the previous article, I cited measurements showing that the distance from which people actually view prints does not grow in proportion to size. Quite apart from that, I — the one who made the prints — looked from a distance and also from up close. I never thought there was one correct distance from which the print was “meant” to be seen.
Looking back, this “whole image from a distance, detail from up close” is very much like the way I have checked focus since the Pentax K-1: look at the whole photograph, and go to the 100% view only where it matters.
What Didn’t Change When the Original Went Digital
One thing I want to be precise about. Limiting exhibition work to silver-halide film was not a matter of my not yet using digital cameras. I was already using them. But the group exhibition at the time had a policy of showing silver-halide work only. I was quite opposed to it, but I didn’t have the influence to change it. Some years later, digital work was being shown too.
Once I started having exhibition prints made from digital files, the lab was still Shashinkosha, and the person at the counter was the same.
The original had changed, from a transparency to a digital file. So had the printing process.
“The way of working was the same. The original went digital and the printing process changed, but the people didn’t.”
I don’t mean the printing method was the same. I mean that the relationship continued: send the work to the same lab, talk to the same person, check the finished print with my own eyes, and have it corrected if needed. That carried on even though the original and the process had changed.
I never had numbers for the print. What I had instead was a process I trusted, and the habit of looking at the finished object with my own eyes.
Whether You Can See It Is for Your Own Eyes to Decide
Back to the question I started with. Can you really see a 0.03 mm blur in a print?
How many millimeters the 0.03 mm on the sensor plane becomes on the print is decided by calculation: 0.15 mm at 5×, about 0.25 mm at A4, 0.6 mm at 20×.
How much the print system widens that width is decided by measuring. Assume the 1999 measurement, and it is of the same order at around 5×, around ten percent at A4, and almost unchanged at 20×. But no published data has been found that would say the same about today’s printers, and applying the single 2019 pigment-printer example, even A4 can land on the “same order” side. This part cannot be decided.
And whether a viewer sees it as blur has not been measured on prints. It is not only that “it depends on the viewer and how they look”; the smallest detectable blur itself moves severalfold with the subject and the contrast.
So no single number for “the print’s circle of confusion” comes out of this article. There are things numbers can handle — the 0.03 mm on the shooting side and the width on the print are both of that kind. But the final judgment — will this blur, on this print, bother the person looking at it? — could not be reduced to a single number with the public data that exists.
For myself, I have made that final judgment by looking at the finished print.
At the end of the previous article, I wrote: “0.03 is not always the right number. Test it once against your own conditions, and then decide whether or not to trust it.”
For prints, my answer is the same.
If it bothers you, make the print and look at the real thing for yourself. Rather than taking my word for whether it’s fine or not — why not trust your own eyes?
For Readers Who Want the Technical Details
The main article ends above. What follows is not a continuation of it but a technical supplement to the places where the main text said “width” and “how fine a pattern.” You can skip it and the argument still stands. At the end, I have gathered what remains unknown even after writing this article.
“Where Half the Contrast Survives” and “the Width of the Blur” Are Not the Same Thing
The values in Table 1 are the spatial frequency at which the contrast of printed stripes falls to half of the original (MTF50), expressed as black-and-white pairs per millimeter (cycles/mm).
What the main text calls “the width of the blur,” on the other hand, is the width over which an edge on the print goes from dark to light — here, the distance over which it changes from 10% to 90% (the 10–90% width).
These two are the same property of the print system seen from different sides, and neither can be converted mechanically into the other. The 1999 measurement expresses the shape of the print system’s blur with a single formula, and only when that shape is assumed does a correspondence hold — an MTF50 of 6.1 cycles/mm going with a 10–90% width of about 0.08 mm, for example. A different shape gives a different width for the same MTF50. Indeed, in a model based on measurements of a photographic-paper chart, the result was a higher MTF50 than the inkjet model in the same source, yet a 10–90% width not much different — because the tail of the edge is long.
That is why the main text does not connect MTF50 values directly to “can you see it.” From a frequency number, no line of “below this diameter it is invisible” can be drawn — that is the conclusion on the research side.
Can Widths Be Added?
When combining the camera-side blur with the print system’s blur, you often see the calculation “square the widths, add, and take the square root.”
That calculation is correct only when both blur shapes are normal (Gaussian) distributions. Only the additivity of variances (σ²) holds for any shape with finite variance; the 10–90% width, the half-width, and the “diameter containing half the energy” cannot in general be added as a sum of squares. The “widens by so many percent” figures in the main text come from numerically superimposing the camera-side blur (a uniform disk) on the print system’s blur (the shape obtained from the 1999 measurement) and reading off the 10–90% width. Read the same superposition with a different definition of width and the percentages change. Width worked out from variance, for example, gives not around ten percent at A4 but something over ten to about twenty percent.
In other words, the “so many percent” depends on which width you measure. That is why the main text says “to within an order of magnitude.”
The 1999–2019 Measurements in a Little More Detail
- 1999–2000, Epson PM770C (dye, 720 dpi). Co-authored by Chiba University and Seiko Epson. Measured with a microdensitometer, with the measuring system’s influence corrected. On glossy-coated, matte-coated and plain paper, the parameter describing the shape of the blur was 0.020 / 0.019 / 0.025 mm. Converted to MTF50, about 6.1 / 6.4 / 4.9 cycles/mm. A 2002 paper by the same group measured the transfer due to ink spread separately from the light scattering in the paper, and found that glossy paper had the largest paper scattering yet the smallest ink spread.
- ca. 2002, Epson Stylus Photo 1270 (dye). About 4.7 cycles/mm on semigloss paper, 4.5 on matte. Rotating the print direction by 90 degrees on the same paper gave about 4.3. The scanner’s influence was not corrected.
- 2015, HP DesignJet Z3100 (pigment, image data at 600 ppi). About 5.3 cycles/mm on matte paper, 5.4 on luster paper. Photographed with a camera; not corrected.
- 2019, Epson SureColor P800 (pigment, glossy paper, image data at 720 ppi, highest quality). A low-contrast edge scanned at 4800 ppi. MTF50 about 3.5–4.25 cycles/mm depending on how it is read, 10–90% width about 0.17 mm. The scanner was confirmed to be nearly lossless up to 16 cycles/mm, and no correction was applied. One printer, one paper, one print, one person.
- 2019, inkjet printer, model not stated (Imatest’s measurement for chart purposes). MTF50 about 5.1–5.3 cycles/mm. Camera included.
Together these are a collection of examples under unmatched conditions, not “typical current values.”
What Happens Inside the Driver (As Far as It Is Known)
First the image is resampled onto the grid the printer accepts. HP publishes this rendering resolution as 300 / 600 / 1200 ppi and tabulates which applies in which print mode. For Epson, documents aimed at RIP software show that the printer receives the image at 360 / 720 ppi or 600 / 1200 ppi depending on the model. For Canon, I could not find this value in the public documentation. What calculation is used for the resampling does not appear in any manufacturer’s public documentation.
After that come color conversion, halftoning (turning tones into the density of dots), dot placement, and finally the spreading of the ink and the scattering in the paper. Of this chain, the stages that clearly soften an edge are the first (resampling) and the last (ink and paper); halftoning mainly adds graininess.
Sharpness-related processing enters as options. Epson’s “PhotoEnhance” is an automatic correction that includes sharpening, and it is not applied if the standard color setting is chosen. Epson’s “Finest Detail,” according to the official description, sharpens the edges of text and line art and “does not affect photographs.” Canon’s Professional Print & Layout has a sharpness correction according to the paper and a correction that uses depth information from the time of shooting; both are checkboxes. Their default states and how strongly they act are not published.
What About Silver-Halide Digital Exposure?
For the silver-halide prints made by photo shops and professional labs — photographic paper exposed by laser or LED and then developed — even fewer measurements have been published.
Kodak’s and Fujifilm’s technical documents for photographic paper, in both the current editions and the editions from the 2000s, give no figures for how blur is transferred or for resolving power. Nor could I find a measurement of the exposure unit and the paper together, as a system.
What is known comes from measurements recorded in patents from the 1990s. In a Kodak patent, the size of the laser spot was about the same as the pixel spacing, and the extent to which a fine white line was filled in by the surrounding density grew as the exposure increased. In other words, the blur of a silver-halide print changes with how heavily it is exposed. From this, it cannot be said that silver halide is sharper than inkjet, nor the reverse.
There Is a “Perceived Resolution” Standard, But…
There is an international standard for evaluating the reproduction of detail in printed matter (ISO/TS 18621-31). But it is a standard that prints a dedicated chart, scans it, and produces a single “score”; it is not a standard for measuring how blur is transferred (MTF). Nor could I find any published scores under this standard for photographic printers.
There are also methods that rate image quality in perceptual steps (JNDs), some of which include the print’s transfer characteristics in their formulas. These are scales of “how good it looks,” not the probability of detecting a given blur. That is what lies behind the main text’s statement that whether you can see it has not been settled.
What Is Still Unknown After Writing This Article
- How much the photographic pigment printers currently on sale widen blur, when measured by a method that removes the influence of the measuring system (no published data was found)
- How much silver-halide digital-exposure systems (exposure unit plus photographic paper) widen blur
- How much the detail on the print changes between handing the image over at 300 / 360 ppi and at 600 / 720 ppi (neither a measurement nor a perception experiment was found)
- The resampling calculation inside printer drivers, and the default states and strength of the automatic corrections
- How small a blur people can still detect on a print — this is where the question this article asks comes to rest
- Why my 1 × 2 m print looked “soft”