The calculation itself is possible. The real question is what that number means.
In 1990, I bought a 4×5 camera — a large-format film camera. That said, I rarely used 4×5 sheet film as such. Most of the time I fitted a roll-film holder and shot 6×12, 6×9 or 6×7. The film was Velvia.
With this kind of talk, one question always comes up.
“So how many megapixels is 4×5, in digital terms?”
It is a natural question. And if you look for a formula, a number will come out. Put a film's resolving-power figure and its dimensions into the formula, and something that looks like a pixel count certainly appears.
The calculation itself is possible. The problem is what that number means.
This article is the record of what I found when I looked into that. Let me say up front: this will not turn into “converting to digital is wrong.” Nor will it turn into “the real answer is X megapixels.” What I found was something a little different.
The Calculation Works. So What Is the Number Counting?
A digital camera's “24 megapixels” is the number of pixels — about 24 million of them — laid out in a grid on the sensor. Let me think of each one as a cell in that grid. It is a count of cells, not a count of how much detail ended up in the photograph. Even with the same 24-megapixel camera, if the lens is soft, if focus is off, if the camera shakes, less detail is recorded. The number of cells does not change. The standard that defines how digital camera resolution is measured also treats the number of cells and “how fine the recorded detail is” as two separate things.
A film's “resolving power,” on the other hand, is a number measured a different way. You photograph fine black-and-white line patterns and find how fine a pattern can still be distinguished. That limit is counted as “so many lines per millimetre.” It is not a count of cells; it is a number for a limit. And the position of that limit moves with the contrast of the pattern — how different the white and the black are — used in the test.
A count of cells, and a limit that depends on conditions. To join these two with an equals sign, you have to make a series of assumptions. The formulas that convert film to a pixel count stand on those assumptions. Put in the figures and a number comes out. But the number that comes out is a number for “what was assumed,” not a number for “how much was recorded.”
Let Me Give the Answer Here
4×5 film cannot be expressed as a single “megapixel equivalent.”
The reason is not that the two cannot be compared. It is that the answer changes depending on what you compare against.
Pixel count is a count of cells; film resolving power is a limit under conditions. They are different kinds of number. And, as we will see next, even within the same manufacturer's data sheet for the same film, the resolving-power figure moves by a factor of two when the conditions change. Converted to a count of cells, that is a factor of four.
So a single number — “4×5 is so many megapixels” — does not come out of the sources I looked at, at least.
But this does not mean “they cannot be compared, so nothing can be said.” Once you decide what the picture is for and how much detail you want to preserve, you can state a conditional range: “for that, you need to capture at this level of fineness.” The second half of this article goes that far.
The Same Film, Yet 80 and 160
Fujifilm's technical data sheet for Velvia lists two figures for resolving power: 80 lines/mm at a contrast of 1.6:1, and 160 lines/mm at 1000:1.
The same film. The same data sheet. On paper, the only thing that differs is the difference between the white and the black of the test pattern. With low-contrast lines (1.6:1) it is 80; with high-contrast lines (1000:1) it is 160.
If you ask which is the “true” resolving power, the answer is that both are the resolving power recorded on the data sheet, each under its own test conditions. Only the conditions differ. Nobody looking at these two numbers would read them as “Velvia's performance doubled.” The performance did not change; the way of measuring did.
But put these numbers into a pixel-count formula and the story changes. If the number of lines per millimetre doubles, you need twice as many cells both horizontally and vertically, so the count of cells is four times larger. Same film, yet depending on which figure you adopt, the “pixel-like number” that comes out differs by a factor of four. Needless to say, the image quality does not differ by a factor of four.
For the record, whether the “lines/mm” in this data sheet counts each line individually or counts a black-and-white pair as one could not be settled from the data sheet alone. Here I keep the sheet's own notation. Which way you read it also changes the number the formula gives.
In other words, before you even reach the formula, the number to put into it is not fixed. That is the first reason there is no single answer.
Resolving Power Depends on Where You Measure It
The second reason is that the resolving power on a film data sheet is the figure for just one stage of the long path a photograph travels before it exists.
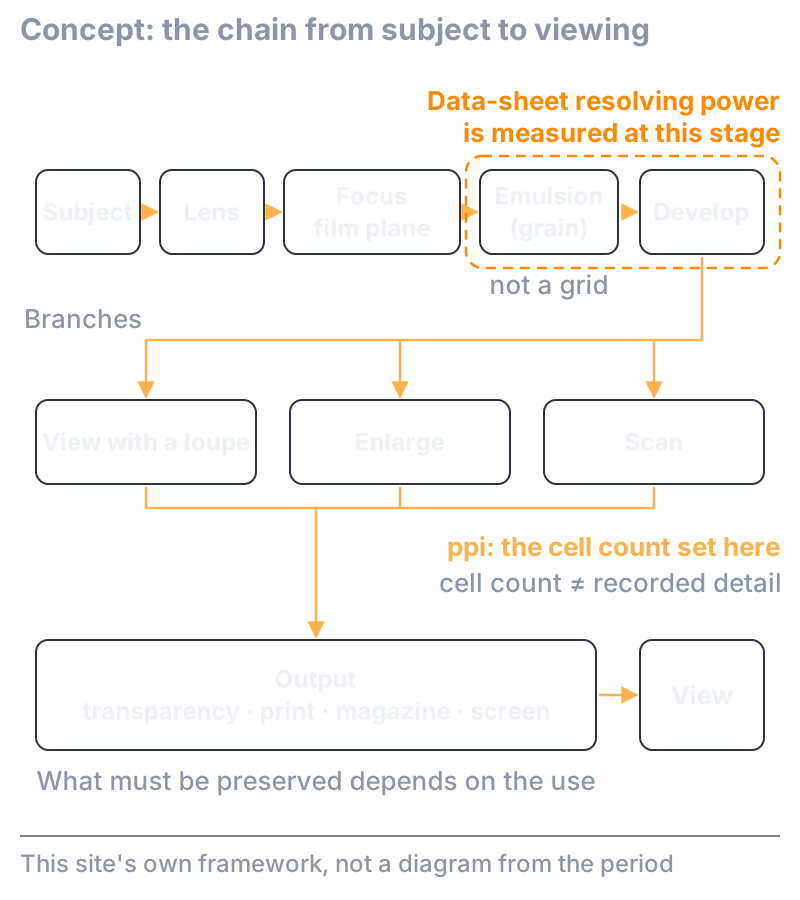
Fig. 1: A film's resolving power depends on where in this chain you measure it. The data-sheet figure is the value at the emulsion and development stages; it does not include the lens, focus, film flatness, scanning or output.
Light from the subject passes through the lens, is brought to focus, depends on whether the film is held flat in the holder, reaches the emulsion, and becomes an image in development. The resolving power on the data sheet is a value measured at this “emulsion and development” stage, under set conditions. Lens blur, focus error and film curl are not in it.
And once development is done, the road is not a single one. You put the transparency on a light table and look at it with a loupe. You print it with an enlarger. You read it with a scanner. Which road you take decides, separately, how much detail survives beyond it.
One thing about the emulsion, too. Film grain (in colour film, dye clouds) is not laid out in a grid like sensor cells. Neither its position nor its arrangement is regular. There is no one-to-one correspondence of “one grain, one pixel,” and the figure that describes a film's granularity is a measurement of density fluctuation — a different quantity from pixel count or from digital noise.
So “film resolving power,” said in one breath, refers to different things depending on whether you mean the data-sheet value, the value through the lens, the value after scanning, or the value on the print. Until you decide where you measure, the number will not settle into one.
Scan It, and a Number Comes Out
“Then just scan it. Scanned data has a pixel count, so that is the film's pixel count” — it is tempting to think this way.
It is true that scanning always produces “a file of so many megapixels.” But a scanner's resolution — ppi — is the number of columns per inch into which the film is divided for reading. Divide it more finely and the file gets bigger, exactly as much as you divided it. But detail that was never recorded on the film does not increase. What was not recorded stays unrecorded, however finely you divide it.
The scanner has its own lens, its own reading aperture, its own noise. “Data scanned at high resolution” is the result of that scanner reading at those settings. It is not a number for the film itself.
The Same 4×5, Yet Different Things to Preserve
The third reason is that even with one and the same transparency, what detail you want to preserve differs with what it is for.
In the 1990s, a professional's 4×5 transparency had several destinations. It was viewed on a light table with a loupe to judge whether it was good. It was handed to prepress for magazines and printed matter. It was enlarged into big prints. The same sheet served as the thing viewed, as an intermediate for platemaking, and as the master for a print. What proportion each route accounted for, the sources I looked at this time do not tell.
In my case, it went like this. Whether a transparency passed or failed, I decided on a light table with a 3.5× loupe. Prints ran from full-sheet size (zenshi) to the larger dai-zenshi sheet, and at most 1×2 m. Some appeared in magazines.
When you look with a loupe, what you want to preserve is the local detail and texture of the original. For a magazine, it is how it looks through the halftone screen and on the paper. For 1×2 m, it is how it looks on the wall. The same transparency, yet different things to preserve.
If what you want to preserve differs, then “how finely you need to capture it to be enough” differs as well.
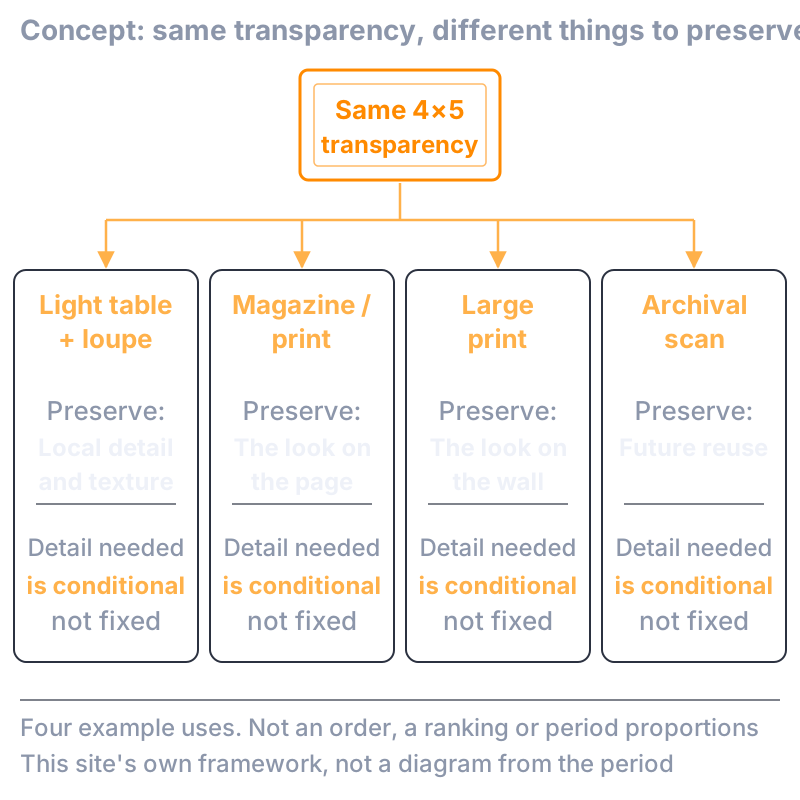
Fig. 2: The same 4×5 transparency, yet what must be preserved differs between a light table with a loupe, a magazine or print, a large print and an archival scan. The fineness of capture needed also changes with the use and the conditions. This is not an order in which one is better than another.
Whether the same detail is “visible” depends on how large you output it, from where you view it, and how much blur you allow. I wrote about those conditions in the circle-of-confusion article. What this article looks at is the other side: even once you have set those conditions, why the answer still does not become “a single number.”
So Is Comparison Meaningless?
Read this far and it may look like the story is “in the end, film and digital cannot be compared.”
That is not it.
Once you set the conditions, there are things you can say. What is it for, how large will it be output, from where will it be viewed, how much detail do you want to preserve? Decide those, and you can give a range: “for this use, to preserve this detail, you need to capture at this level of fineness.” The answer is not a single number but a range for each set of conditions. This is the way of looking that this site's series of investigations adopts; it is not a claim that photographers of the period thought this way.
Seen this way, the reason 4×5 can be at an advantage can also be stated concretely. For a print of the same size, 4×5 needs only about one third the enlargement of 35 mm film. With less enlargement, grain and blur on the film surface can become less noticeable. But this is not a story of “so 4×5 is higher quality.” Enlargement is only one stage on the path; unless the lens, focus, film flatness, development and output conditions are also in place, the result changes.
So can we draw up a scoreboard — “4×5 versus a high-megapixel digital camera, which is better?” Not unless there is a comparison with the same subject, the same output and the same way of viewing. It is not a question that gets settled by looking it up; until you line those things up, the very thing to be compared is not defined.
So I replace the question.
Not “how many megapixels is 4×5?” but “what do I want to preserve, and how finely do I need to capture it for that?”
Reframed this way, an answer comes out. Conditionally.
The Next Time You See “Megapixel Equivalent”
Looking at one of my own prints enlarged to 1×2 m, I once thought: it is soft. Step close and you can tell at once. I do not believe it was a focus problem. Then where along the path was it lost? I still do not know. The resolving-power figure on the data sheet contained nothing about the path beyond it.
The next time you see a figure like “X is equivalent to so many megapixels,” I think you can ask this: measured at which contrast? With the lens included? After scanning? What is the output? Viewed from where? The number is not wrong. Only the conditions have been left out.
Let me also write down two things that are not known. One is whether the “lines/mm” on the film data sheet counts individual lines or line pairs. The other is how much detail was actually demanded for each use at the time — the real distribution. Neither could be determined within the range I looked at this time.
And this is not a story about film alone. Every time we try to say “high image quality” with a single number, the same thing happens. For instance, what the phrase “rich gradation,” so often used at the time, actually referred to. That is the same question.
For Those Who Want to Go a Little Deeper
The conclusion this article needs is complete at this point. What follows is a supplement for anyone who wants to look a little more closely at the places where the main text skipped the formulas and definitions. There are no new claims. No other “correct pixel count” appears either.
“lines/mm” and “lp/mm”
The standard for digital camera resolution (ISO 12233) defines 1 lp/mm (line pair) = 1 cycle/mm = 2 lines/mm. Counting a black-and-white pair as one is lp/mm; counting each line is lines/mm. As I wrote in the main text, which of these definitions the “lines/mm” in Fujifilm's data sheet corresponds to could not be determined from the material I referred to this time. That is why I have not re-read 80 and 160 as “line pairs.”
What the Conversion Formula Assumes
A formula that converts film to a pixel count has roughly this shape. With f as the number of cycles per millimetre and W×H mm as the film dimensions, assigning two cells per cycle in each direction gives a cell count of 4 × f² × W × H.
What this formula implicitly assumes includes at least the following. That f is a count of line pairs (cycles). That the same fineness is recorded across the whole film. That it is received by an ideal black-and-white grid. That the effect of each stage — lens, focus, film plane, development, scanning, output — is known. That noise is low enough. That the offset between the pattern and the cell positions can be ignored. And that “could be distinguished” means the same thing on the film side and on the digital side.
As one example: read the 80 and 160 from the main text as cycle counts for the sake of argument, assume a 35 mm frame of 36 × 24 mm that is uniform across its whole area, and put them into the formula — the cell counts that come out are roughly 22.1 million and 88.5 million. Same film, four times apart, just because the criterion differs. This is a worked example to show how far the conversion moves even with figures from the same data sheet; it is not Velvia's pixel count, nor the effective pixel count of 35 mm film. Change one assumption and you get a different number. For 4×5, I have not done this calculation. There is no basis for saying the assumptions above hold for 4×5, the effective film dimensions vary with the holder, and any number produced would only walk off on its own as “the pixel count of 4×5.”
Let me also note what this formula throws away: the shape of the resolving-power curve; the changes with contrast, exposure and development; the statistics of granularity and noise; the difference between the layered structure of colour film and a digital colour filter array; the influence of lens and camera; the conditions of scanning, enlarging, output and viewing; positional offset; and uncertainty. That a lens's own resolving power varies with the aperture and the position in the frame is something I covered in the f/8 article.
Half the Cell Frequency
For a cell pitch p, 1/(2p) is called the Nyquist frequency. It is a boundary value — “a pattern up to this fineness can, under ideal conditions, be reconstructed” — not a guarantee that “detail up to this fineness is recorded.” Even when one cycle lands on exactly two cells, the contrast of the pattern can be lost depending on how the pattern and the cells line up. This is one of the reasons resolving power cannot be inferred from the number of cells.
Colour Filters and One Pixel
In a digital camera with what is called a Bayer array, each pixel receives only one of red, green or blue. It is not measuring the three colours at the same location at once; the missing colours are estimated from the neighbours. How that estimation is done, the optical low-pass filter and the sharpening all change how detail and false colour appear, even at the same pixel count. This is why “pixel count,” “number of photosites” and “pixel count of the output file” need to be kept apart.
Film Does Not Merely Blur
Kodak's literature states that, through adjacency effects in development, a film's frequency response can exceed 100% under some conditions. Film is not always a passive layer that only blurs detail; under some conditions it also works to strengthen local contrast. This is one reason that putting film into a formula as “a filter that applies a fixed blur” is a simplification.
The Granularity Figure
A film's granularity is conventionally expressed as “RMS granularity”: the fluctuation of density is measured through a 48 µm aperture in an area of density 1.0, and the standard deviation is multiplied by 1000. It is not the size of the grains themselves, and it is measured differently from digital noise.
In Fujifilm's data, the RMS granularity of Velvia 50 is 9 and that of Velvia 100 is 8. There is no simple correspondence in which the lower-speed film has the better granularity figure. It is one example showing that the resolving-power figure and the granularity figure do not sit on a single axis.
The Scanner's Numbers
The pixel count of a scanned file is a number for the size of the file, determined by the scanning resolution (columns per inch) and the film dimensions. The actual resolving power of a film scanner is to be measured for the device as a whole, not taken from the nominal ppi setting (ISO 16067-2). The scanner has a lens, a reading aperture and noise, and the result that includes them is its actual resolving power.
It is also instructive that the guidelines for archival digitisation (FADGI) set different values by format: roughly 1000–4000 ppi for film from 35 mm up to but not including 4×5, and roughly 500–2000 ppi for 4×5 and larger. These are not “the pixel count inherent in the film”; they are operational values decided from the purpose and cost of preservation. The very fact that the value differs by format shows that this ppi is not a figure intrinsic to the film.
The Enlargement Figure
The “about one third” in the main text is a matter of geometry: to enlarge to a width of 297 mm, the magnification is about 8× for 35 mm film (36 mm wide) and about 2.5× for 4×5 (taking the effective width as about 120 mm). Grain and blur of the same size on the film surface end up smaller in the final output the lower the enlargement. But, as I wrote in the main text, this is one stage on the path, not the result including lens, focus, flatness, development and output.
What Can Be Compared, and What Cannot
When film and digital numbers are placed side by side, some can be compared directly, some need a bridge, and some are not meaningful to compare at all.
| What you try to compare | Verdict | Reason |
|---|---|---|
| Film's limiting resolving power vs. a sensor's Nyquist frequency | Not directly comparable | One is a detection limit under conditions; the other is a boundary value fixed by the cells |
| Film granularity vs. digital noise | Needs a bridge | The measuring window, density and statistics differ; conditions for comparing them in the final output are required |
| Scanner ppi vs. detail on the film | Not meaningful as is | One is a count of divisions; the other is an amount recorded |
| The layers of colour film vs. the number of colour-filtered pixels | Not one-to-one | Colour is recorded in different ways |
| The look, with output and viewing made the same | Conditionally comparable | Only when use, output, viewing conditions and criterion are fixed |
Table 1: How to compare film and digital numbers. Only the last row is “conditionally comparable”; the rest place numbers of different kinds side by side.
The Idea of a Conditional Range
Let me lay out, as a procedure, the idea from the main text that “set the conditions and a range can be stated.”
- First, put the two things being compared to the same final use (viewing with a loupe, a magazine, or a print on the wall).
- Next, declare which stage the film-side value was measured at (data-sheet value, through the lens, or after scanning).
- For each criterion to be preserved, set the required fineness, contrast, noise and colour conditions.
- Calculate “two cells per cycle” as a necessary condition, but do not treat it as sufficient.
- For each candidate capture fineness, confirm with the actual equipment, processing and output.
- Keep the range that satisfies the criterion, uncertainty included.
What remains is not a single number but a range for each criterion. This is the way of looking adopted in this site's series of investigations; photographers and manufacturers of the time did not think in these terms.
“From How Many Megapixels Did Digital Overtake Film?”
This question, too, does not become a single number, for the same reason. Unless you decide for which use, for which output and by which criterion “overtook” is judged, the thing to be judged is not defined. How the early professional digital cameras were chosen becomes a separate story that pixel count alone cannot explain.
4×5 vs. a High-Megapixel Digital Camera for a Big Print
“For a large print, which is better — 4×5 film, or a single frame from today's high-megapixel digital camera?” This comparison cannot be settled unless there are measurements with the same subject, equivalent lens conditions, the same development or scanning, and the same paper and viewing distance. It is not that one has been found better; it is that the comparison that would decide it has not been assembled. This article's answer stops there.